If you are into stock trading, you often work with the Nifty index. But many of you thinking about how to utilize candlestick charts properly. It is generally used to analyze market movement. Candlestick charts are powerful tools that help you read market sentiment and predict future price movements. Using this you can make better trading decisions. This read explores how you can apply candlestick charts for Nifty analysis.
Table of Contents
Understanding Candlestick Components
Each candlestick shows four essential price points. They are open, high, low, and close. The body of the candlestick symbolizes the opening and closing price range. If the body is green, the closing price is higher than the opening price. This indicating market has closed above his opening level. If it is red, the closing price is lower. It is signaling a market has closed below his opening level. The wicks above and below the body show the highest and lowest prices during a particular period. Combination of multiple candlestick together also know as price patterns helps in identifying market is in a bullish trend or a bearish trend.
Identifying Patterns for Nifty
In Nifty analysis, candlestick patterns are common. There are multiple single candlestick patterns like bullish and bearish engulfing, hammer, and doji. A bullish engulfing pattern shows the Nifty is going to rise after a downtrend. A doji suggests indecision. It might denote a reversal of the trend. Before understanding the pattern of each candlestick it is important to understand why does these patterns form at the first place. This can help traders to make more sense and build conviction around candlestick and price patterns.
Why Candlestick Patterns are formed?
The theory behind the formation of candlestick patterns is very simple. The market is driven by broadly two categories buyers and sellers. In each transaction in the market there is a buyer and opposite to it there is a seller. Now depending on the timeframe these candlestick patterns are looked at, if we see one day candle stick pattern it has information of buyers and sellers’ behaviour of the past six and half hours. In that small players, big players everyone would have participated. So buyer seller behavioural information of past 6 hrs combined into a single candlesticks into one candle is looked at. Above mentioned pattern tries to give information broadly what happened in the market today. For instance, Doji Candlestick
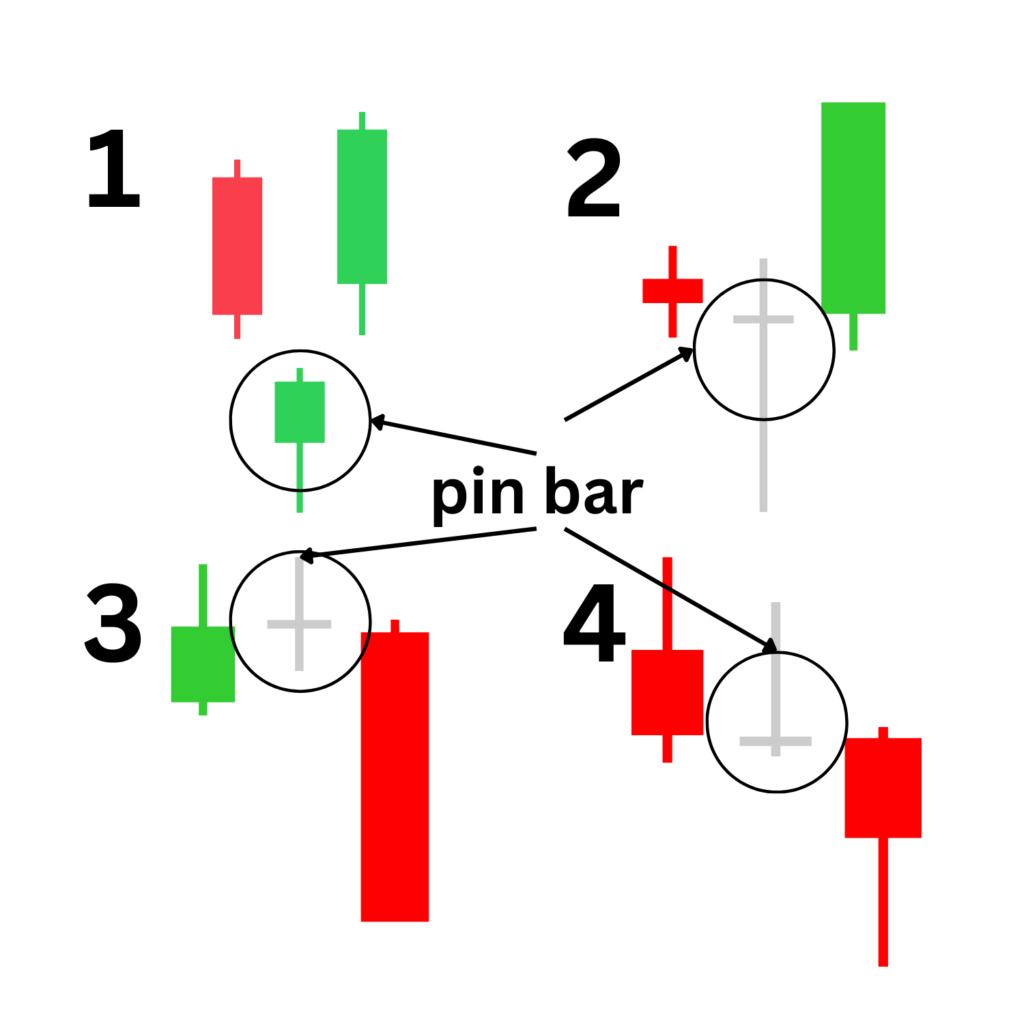
Pin Bar Candlestick – Doji
To understand this candlestick, let’s assume this is one full-day candlestick that we see in the picture. In picture 1 & 2, there are pin bar candlesticks both are that the market has tried to fall but, at some point (price level) buyers got activated during the day, and pushed the price above by initiating buying.
Long wick indicates in 1 & 2, even though sellers were dominating, buyers took control and didn’t allow the market to fall beyond a level. It can also be read as sellers were selling but at the bottom tip of the wyck buyers were waiting to start buying aggressively. While body of the candle could relay information like both buyers and sellers are aggressive at a price level or within a price range. In picture 2 range is very small where buyers are sellers are agressively transacting on that given day, while in picture 1 buyers got little more aggresive compared to sellers, hence little body got formed.

Making Predictions
Traders use these patterns to predict the short-term movement of Nifty or any other instrument. When candlestick analysis is blended with other indicators, you can create an effective strategy. This can improve your chances of success in trading and investing in the stock market. This makes Stock Market a game of predictions that have certain probability. To improve the probability, it’s advised to not look at single candlestick, but combination of candlesticks that forms price patterns or chart patterns. Trader can get more information, that would reduce his/her probability of going wrong in his predictions.
Wrapping up
Candlestick charts and it’s combinations across price patterns reflect the most probable scenario and help in decoding market emotions. When applied same principle to Nifty analysis, then it would provide very valuable data for price action. Thus it helps traders to make the right decisions.
